Physical Address
304 North Cardinal St.
Dorchester Center, MA 02124
Physical Address
304 North Cardinal St.
Dorchester Center, MA 02124


Earnings season starts Tuesday, and the options market has already placed its bets. Traders are pricing a move of about 4.4% in JPMorgan, 5.8% in Goldman Sachs and a full 8% in UnitedHealth once their reports hit (Regards of Wall Street).
Those numbers are called implied moves, sometimes “expected moves.” They’re one of the most useful tools in investing that most people have never heard of.
You don’t need to trade options to use them. If you own a stock that reports this week, the implied move tells you how big a swing the market thinks is normal. That alone can keep you from panicking over a drop that was priced in all along.
An implied move is the size of the stock move, up or down, that options prices suggest for a specific period, usually around an earnings report.
Notice the word “or.” An implied move of 4.4% doesn’t say the stock will rise 4.4%. It says the market expects a swing of roughly that size in either direction, and it has no opinion on which way.
Think of it like a weather forecast that says “big storm coming” without saying which side of town gets hit.
Options give buyers the right to buy (a call) or sell (a put) a stock at a set price before a set date. Bigger expected swings make those options more valuable, since there’s a better chance they pay off. Uncertainty costs money.
So before an earnings report, option prices rise. The market’s best guess about future swings, called implied volatility, climbs as the date approaches. Work backward from those prices and you get the move the market is bracing for.
Nobody at the exchange sets this number. Traders do. It comes from thousands of traders putting real money on how wild the next few days will be.
There are two common ways. Both are easier than they sound.
A straddle means buying a call and a put at the same strike price, usually the one closest to the current stock price. It profits if the stock moves far enough in either direction, so its price is basically the market’s bet on how far the stock will travel.
The popular shortcut takes 85% of the straddle’s cost, using the first expiration date after earnings (moomoo).
Here’s an illustration with JPMorgan, which closed Friday at $332.99. Say the at-the-money straddle expiring this Friday costs $17.25:
That’s in line with the 4.4% move traders are pricing for JPMorgan this week. (The $17.25 is an example to show the math, not a live quote.)
Method two uses implied volatility directly:
Implied move = stock price × implied volatility × √(days to expiration ÷ 365)
For a $100 stock with 20% implied volatility and 30 days left, that’s 100 × 0.20 × √(30/365), or about $5.73 (LuxAlgo). This version gives you a “one standard deviation” range. In theory, the stock should finish inside it about two times out of three.
Both methods land in the same neighborhood. The numbers won’t match exactly, which is why different websites often show slightly different implied moves for the same stock.
Where it gets interesting is comparing what options are pricing now with how much a stock has actually moved after past reports. The chart below compares this week’s implied moves with each stock’s average earnings move over the last 10 years.
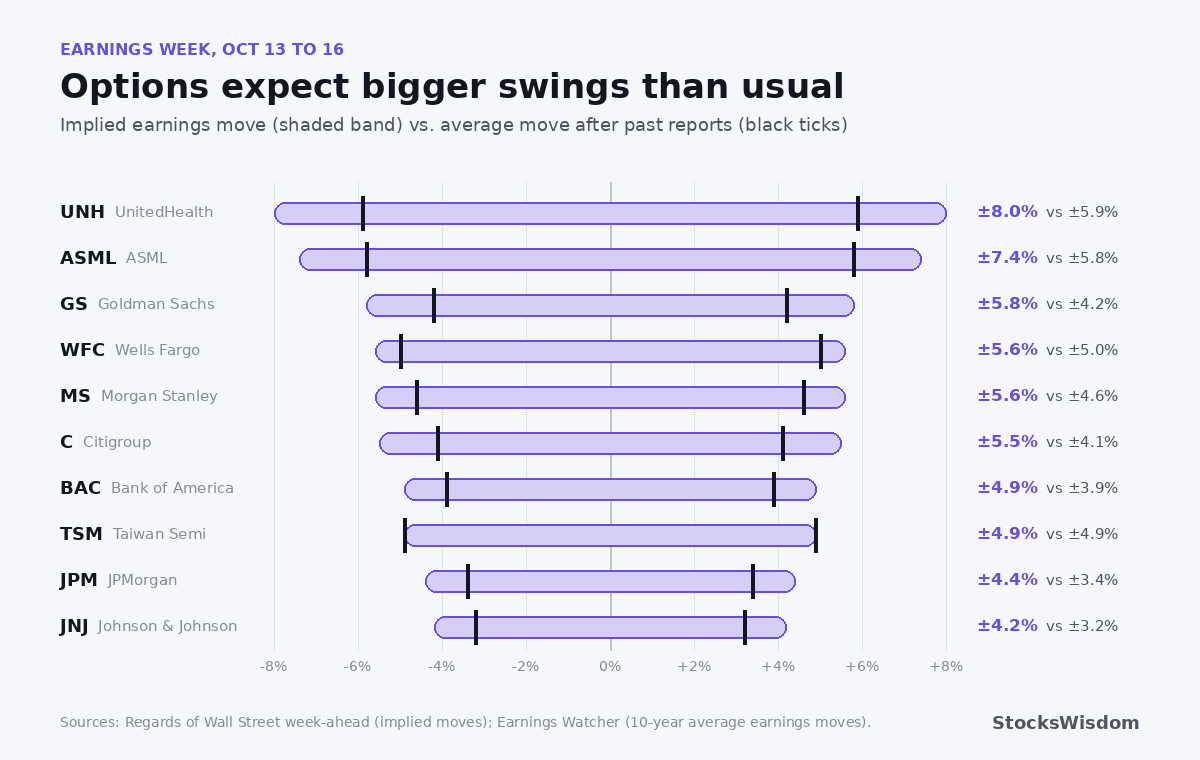
Almost every name on the list is pricing a bigger swing than usual. JPMorgan’s 4.4% compares with a 10-year average of about 3.4%, and Goldman’s 5.8% compares with about 4.2% (Earnings Watcher).
One likely reason is the calendar. September inflation data comes out Wednesday, with producer prices and retail sales on Thursday, so options expiring Friday have to cover all of that on top of earnings. With the 10-year Treasury yield at its highest level since 2002 and rate-hike odds back on the table, traders are paying up for protection.
Here’s the part that costs new options traders money.
Implied volatility pumps up before earnings because nobody knows what the report will say. Once the numbers come out, that uncertainty disappears, and implied volatility usually drops fast. Traders call this IV crush.
That means you can buy a call, watch the stock go up after earnings, and still lose money on the trade. Yes, really. If the stock rose less than the implied move, the drop in volatility can wipe out your gain (tastylive).
Option sellers sit on the other side. They collect that inflated premium and benefit from the crush. But they take on the risk of a huge gap move, which can mean large losses.
So here’s a simple rule. When you buy options before earnings, you aren’t betting the stock moves. You’re betting it moves more than the implied move.
Even if you never touch an options contract, implied moves are worth checking before a company you own reports.
Set expectations. If a stock you own has an 8% implied move, a 6% drop the next morning is inside the normal range. That’s useful context before you hit the sell button.
Size your positions. A stock pricing a 10% earnings swing can hurt a portfolio more than one pricing 3%. If a single report could cost you more than you’re comfortable losing, trim before the date.
Spot surprises. When a stock moves well beyond its implied move, the market learned something truly new. Those are the reports worth reading closely.
Compare with history. An implied move far above a stock’s usual earnings move means options are expensive. Far below can mean traders are too relaxed.
Many brokerages show the expected move right on the options chain. If yours doesn’t, the straddle shortcut works with any quote screen. And to see how a stock is trending heading into its report, StocksWisdom shows sentiment, technical signals and a 30-day forecast for each ticker.
Implied moves are a market estimate, not a promise. Real stock returns have “fat tails,” which means big surprise moves happen more often than the math assumes (LuxAlgo).
They also change constantly. The implied move on Monday morning can differ from Friday’s, and different calculation methods give different answers.
And they’re silent on direction. A 5% implied move is equally consistent with a 5% gain or a 5% loss.
Yes. The two terms are used interchangeably. Both describe the size of the move options prices suggest for a given period.
In theory, a stock should stay within its one-standard-deviation implied move about two thirds of the time. In practice, earnings surprises cause bigger moves more often than the model expects.
Yes, and it happens regularly. A big beat, a big miss or a guidance change can send a stock well past its implied move.
Pick one stock from the list, write down its implied move and check it against the actual move after the report. Do it for a few weeks and you’ll start reading earnings season very differently. Which report are you watching most closely?
Not financial advice. Do your own research.