Physical Address
304 North Cardinal St.
Dorchester Center, MA 02124
Physical Address
304 North Cardinal St.
Dorchester Center, MA 02124


Is a $50 stock cheap? Is a $900 stock expensive? You can’t tell from the price alone. A $900 share of a hugely profitable company can be a better deal than a $50 share of one that barely makes money.
That’s the problem the P/E ratio solves. It’s the most widely used valuation number in investing, it shows up on every stock quote page, and it takes about two minutes to understand.
Right now the S&P 500 trades at about 19.1 times expected earnings for the next 12 months, right on its 10-year average (FactSet). By the end of this guide you’ll know what that means, and how to use P/E to judge whether any stock looks cheap or expensive.
P/E stands for price-to-earnings. It compares a company’s share price with the profit it makes per share.
P/E ratio = share price ÷ earnings per share (EPS)
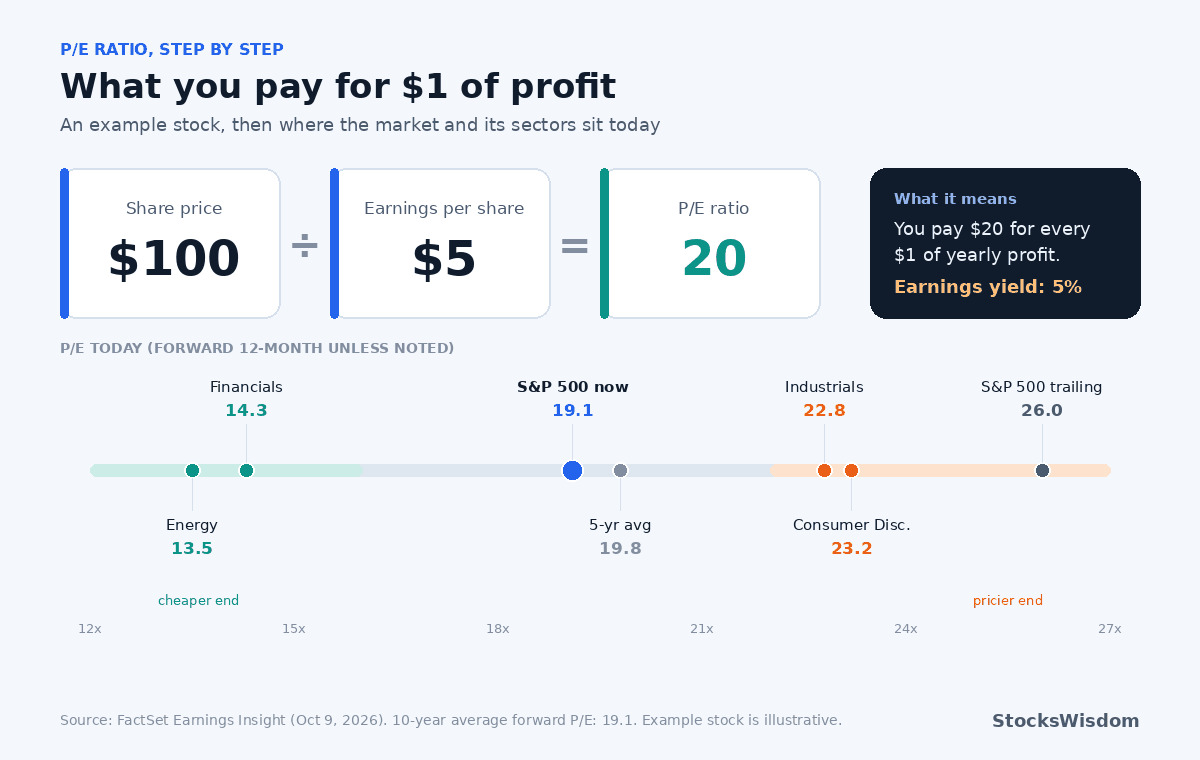
Say a stock trades at $100 and the company earned $5 per share over the past year. Its P/E is 100 ÷ 5 = 20.
The simplest way to read that: investors are paying $20 for every $1 of yearly profit. A P/E of 10 means paying $10 for that same dollar. A P/E of 50 means paying $50.
The graphic below walks through the math step by step, along with where the market and its sectors stand today.
You’ll see two versions, and they can be very different.
Trailing P/E uses actual earnings from the past 12 months. It’s based on real numbers, but it looks backward.
Forward P/E uses analysts’ estimates for the next 12 months. It looks ahead, but those estimates can be wrong.
The gap between them tells you something. The S&P 500’s trailing P/E is about 26.0, while its forward P/E is 19.1. That big difference exists because analysts expect earnings to keep growing fast: FactSet shows expected S&P 500 earnings growth of about 32.7% for 2026 and 15.8% for 2027.
If those forecasts hold, today’s prices look reasonable. If earnings disappoint, the “real” P/E ends up much higher than it looks.
There’s no single magic number. A “good” P/E depends on what you compare it to. Three comparisons matter most.
The S&P 500’s forward P/E of 19.1 is a handy benchmark. It matches the 10-year average of 19.1 and sits a bit below the 5-year average of 19.8. A stock trading far above that is priced for faster growth than the average company.
Different industries carry very different P/Es. Here’s where the S&P 500’s sectors at the extremes stand on forward earnings:
| Sector | Forward P/E |
|---|---|
| Consumer Discretionary | 23.2 |
| Industrials | 22.8 |
| S&P 500 overall | 19.1 |
| Financials | 14.3 |
| Energy | 13.5 |
A bank at 14 times earnings and a retailer at 23 times can both be fairly priced for their industries. Comparing a bank’s P/E with a software company’s tells you very little.
If a company has traded between 15 and 20 times earnings for a decade and now sits at 12, something changed. Either the stock is on sale, or investors expect trouble.
A high P/E usually means investors expect strong growth. They’re willing to pay more today because they think profits will be much bigger later. Fast-growing tech companies often trade at 30, 40 or higher.
A low P/E can mean a bargain. It can also mean the market sees problems ahead, like shrinking sales, rising debt or an industry in decline.
That second case has a name: a value trap. A stock looks cheap on P/E, but earnings keep falling, so the P/E never gets “fixed” by a rising price. We looked at that kind of debate in our post on Redwire’s 52-week lows.
Here’s the rule of thumb: a low P/E is a question, not an answer. Find out why it’s low.
To compare a fast grower with a slow one, investors use the PEG ratio:
PEG = P/E ÷ expected yearly earnings growth rate
Imagine two companies:
Company A looks expensive on P/E, but cheaper once you account for growth. A PEG around 1 is often treated as fair, though it depends on how reliable those growth forecasts are.
Flip the P/E and you get the earnings yield: earnings ÷ price. A P/E of 20 equals a 5% earnings yield.
That makes it easy to compare stocks with bonds. At a forward P/E of 19.1, the S&P 500’s earnings yield is about 5.2%. With the 10-year Treasury yield also above 5% this month, stocks aren’t offering much extra profit per dollar compared with “risk-free” government bonds. That doesn’t mean stocks will fall, but it’s one reason some investors are more cautious right now. We explained how those Treasury yields work in our bonds at 5% guide.
P/E has blind spots:
If you want to see where P/E numbers come from in the first place, our walkthrough on how to read an earnings report shows exactly where to find EPS.
Think of P/E as a first filter, not a final decision. A simple routine:
Neither by itself. A high P/E means investors expect strong growth. It’s fine if that growth arrives, and painful if it doesn’t.
The S&P 500’s forward P/E has averaged about 19.1 over the past 10 years and 19.8 over the past five, according to FactSet. Its current forward P/E is about 19.1.
Yes, when a company loses money. Most websites show it as “N/A” because a negative P/E isn’t useful for valuation.
The P/E ratio won’t tell you everything about a stock, but it stops you from overpaying blindly. What’s the highest P/E you’d be willing to pay for a stock you believe in?
Not financial advice. Do your own research.