Physical Address
304 North Cardinal St.
Dorchester Center, MA 02124
Physical Address
304 North Cardinal St.
Dorchester Center, MA 02124


Johnson & Johnson did everything a company is supposed to do on earnings day this week. It beat Wall Street’s profit estimate. It beat the revenue estimate. It raised its full-year outlook. Then the stock fell more than 6% on Tuesday, October 13.
If that makes no sense to you, you’re not alone, and it’s the best possible reason to learn how to read an earnings report yourself. Headlines give you two numbers. The report gives you dozens, and the stock often reacts to the ones that never make the headline.
So let’s use J&J’s third quarter as a live example. We’re about 9% of the way through S&P 500 reporting season, with 79 more index companies due next week, according to FactSet. You’ll get plenty of chances to practice.
Every report gets judged first on two numbers: earnings per share (EPS) and revenue, each compared with the average analyst estimate. J&J reported adjusted EPS of $2.59 against roughly $2.54 expected, and revenue of $25.4 billion against about $25.28 billion, per Reuters.
Two beats. Clean sweep, right?
Not quite. A “beat” only means the company did better than a forecast, and companies spend months gently steering those forecasts lower. That’s why beats are the norm. So far this season 84% of S&P 500 companies have topped EPS estimates, above the five-year average of 78%. The more telling figure is the size of the beat: companies are coming in just 2.6% above estimates in aggregate, far below the five-year average of 7.5%.
A beat is the floor, not the ceiling.
The graphic below shows how I’d walk through J&J’s report, one number at a time, in the order that tells you the most.
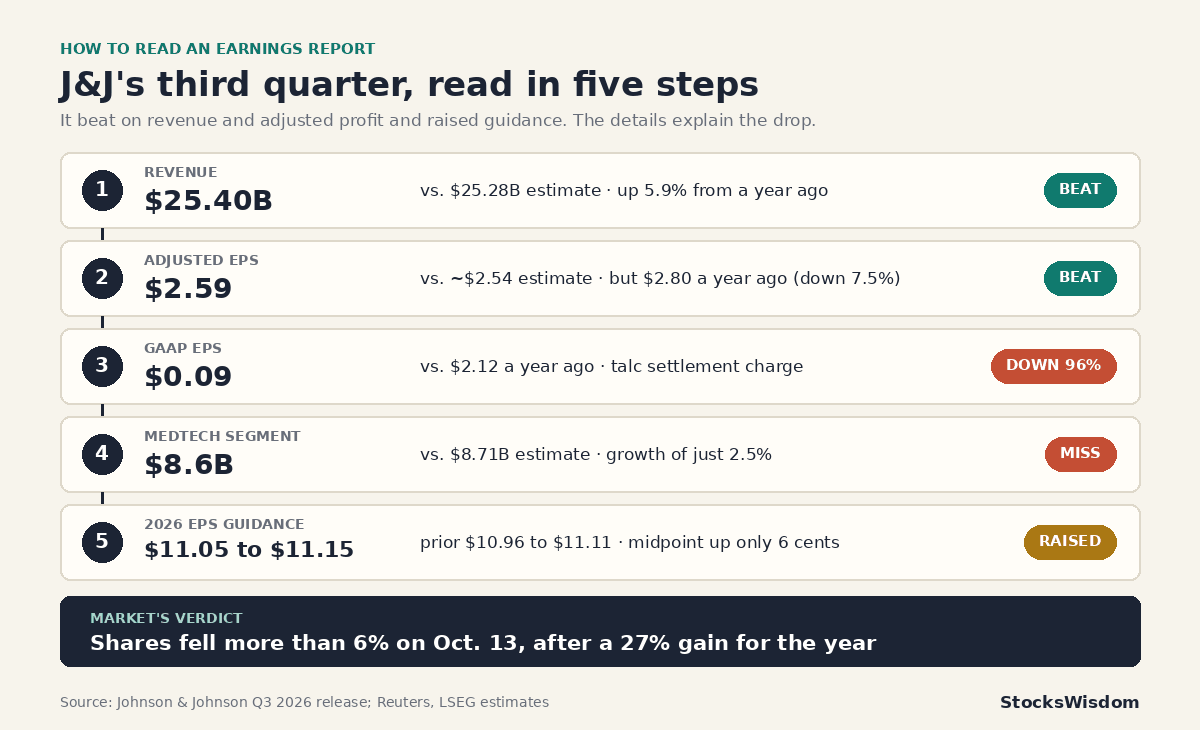
Revenue (also called sales or the “top line”) is the money customers paid. It’s much harder to dress up than profit, so I read it first.
J&J’s sales rose 5.9% to $25.4 billion, according to the company’s earnings release. Look for the phrase “operational growth” too. That strips out currency swings, which matters for a global company. Here it was 6.0%, so currency barely moved the needle.
Healthy, not spectacular.
This is where most beginners get lost, and where J&J’s report is a perfect teaching case.
Companies report two kinds of profit. GAAP earnings follow the official accounting rules and include everything. Adjusted (or “non-GAAP”) earnings remove items management considers one-time or non-cash, like legal settlements, acquisition costs and amortization of intangible assets.
J&J’s GAAP EPS was $0.09. A year earlier it was $2.12. That’s a 95.8% collapse, driven mostly by a special charge tied to its proposed talc litigation settlement, plus costs from two deals. Adjusted EPS, which excludes those items, was $2.59.
Wall Street compares estimates to the adjusted figure, which is why the headline said “beat.” But here’s something the headline skipped: adjusted EPS was $2.80 a year ago. So even on the friendlier measure, profit per share fell 7.5%.
Beating an estimate and growing are different things. Always check the year-ago number.
| J&J Q3 2026 metric | Result | Compared with | What it tells you |
|---|---|---|---|
| Revenue | $25.40 billion | $25.28 billion estimate | Beat, up 5.9% from a year ago |
| Adjusted EPS | $2.59 | About $2.54 estimate | Beat, but down from $2.80 a year ago |
| GAAP EPS | $0.09 | $2.12 a year ago | Talc charge wiped out reported profit |
| MedTech sales | $8.6 billion | $8.71 billion estimate | Miss, up just 2.5% |
| 2026 adjusted EPS guidance | $11.05 to $11.15 | $10.96 to $11.11 in July | Raised, midpoint up 6 cents |
Big companies break revenue into business units. Investors care about these because one weak division can tell you more about the next two years than a strong total.
J&J’s drug business, Innovative Medicine, grew 7.7% to $16.76 billion. Its medical device unit, MedTech, grew only 2.5% to $8.6 billion and missed the $8.71 billion LSEG estimate, according to Reuters via AOL. Sales outside the U.S. were roughly flat.
The company didn’t sugarcoat it. “Our performance is below the standard we have set internally and below the expectations we previously communicated to investors,” said Tim Schmid, who runs medical technology. “Simply put, we can do better.”
When an executive says that on the call, believe them. It usually means the weakness isn’t a one-quarter blip.
Guidance is management’s forecast for the rest of the year. Since stock prices are bets on the future, guidance often matters more than the quarter that just ended.
J&J raised its 2026 adjusted EPS range to $11.05 to $11.15, from $10.96 to $11.11. That sounds good until you do the math. The midpoint rose just 6 cents, from $11.04 to $11.10. That’s about half a percent. The sales range moved even less: the midpoint went from $101.1 billion to $101.2 billion.
A raise that small is housekeeping. It isn’t a signal that business is accelerating.
Put it together and the 6% drop makes sense. The shares closed at $263.73 the day before the report and were up 27% for the year, per Reuters. A stock priced for strength needs a report that shows strength, and J&J delivered a modest beat, falling adjusted profit, a device miss and a token guidance bump.
The market wasn’t grading the quarter against analysts’ estimates. It was grading it against the price.
That’s the gap headlines miss. You’ll see it again this season: plenty of companies will “beat” and fall, and a few will “miss” and rally because the bad news was already baked in.
You don’t need to read every page. A 10-minute routine covers most of what matters:
Do that before you buy or sell anything on an earnings headline. If you own a fund rather than single stocks, the routine still helps you read the season. With blended S&P 500 earnings growth tracking 29.0% and the index trading at 19.0 times forward earnings (FactSet), the market is assuming a lot goes right.
It also helps to check how a stock was positioned going into the report. Tools like StocksWisdom show a stock’s sentiment, technical signals and a 30-day forecast, which gives you a quick read on how much optimism was already in the price before the numbers hit.
Check the investor relations page on the company’s website, or search the SEC’s EDGAR database for the 8-K filing. J&J’s full release, with all the tables, is posted as an 8-K exhibit on sec.gov.
Use both. Adjusted EPS shows the ongoing business more clearly, but if a company’s “one-time” charges show up every year, they aren’t one-time. Compare the two over several quarters.
Many companies report before the market opens or after it closes. Traders react in extended-hours sessions, where volume is thin and swings can be exaggerated. The regular-session move is usually the better signal.
Which number do you check first when a company you own reports earnings? Tell me in the comments.
Not financial advice. Do your own research.