Physical Address
304 North Cardinal St.
Dorchester Center, MA 02124
Physical Address
304 North Cardinal St.
Dorchester Center, MA 02124

Wholesale prices keep climbing, just a little slower than Wall Street feared. The October Producer Price Index, released Friday morning, showed prices paid to U.S. producers rose 0.3% for the month, a touch under the 0.4% economists expected. Over the past 12 months, though, PPI is up 6.5%. That’s the fastest annual pace since November 2022, according to CNBC.
So it was a “miss” on the monthly number and a fresh four-year high on the yearly one. Bond traders cared more about the second part.
The 10-year Treasury yield finished the day around 5.15%, up roughly 29 basis points this week. The 2-year jumped about 35 basis points over the same stretch, closing near 4.87%, per Investrade’s market review. Stocks slipped too: the Nasdaq fell 0.91% and the S&P 500 lost 0.40%, while the Dow eked out a 0.10% gain.
PPI tracks what businesses get paid for goods and services before anything reaches a store shelf or your monthly bill. Think of it as inflation one step upstream.
“Final demand” is the headline version. It covers goods, services and construction sold to end users, which is why economists treat it as an early read on where consumer prices could head. The core measures strip out food and energy because those two swing wildly from month to month.
Here’s how the main pieces looked in October:
| Measure | October change | 12-month change |
|---|---|---|
| Final demand (headline) | +0.3% (0.4% expected) | +6.5% |
| Less food and energy | +0.3% (in line) | +5.0% |
| Less food, energy and trade services | +0.5% (0.3% expected) | +4.9% |
| Final demand foods | +1.3% | +1.7% |
| Final demand energy | -0.1% | +37.0% |
Goods prices rose 0.5% and services gained 0.2%. The September headline was revised up to 1.4% from 1.3%, per Stock Titan’s breakdown of the release.
Energy is the reason October looked mild. Energy prices dipped 0.1% after surging more than 10% in September. Take that one category out, and the picture gets worse.
The measure the Bureau of Labor Statistics itself highlights (excluding food, energy and trade services) rose 0.5% against a 0.3% forecast. BLS said more than 60% of the October advance came from goods prices outside food and energy. That’s the stuff companies make from plastic, metal and electronics, and it’s exactly where you don’t want inflation spreading.
Food was the other sore spot. Food prices at the producer level jumped 1.3%, the biggest monthly gain since February, according to Transport Topics.
Oil prices have stayed high since the U.S.-Iran conflict began earlier this year, and Haver Analytics puts final demand energy prices up 37.0% from a year ago. Expensive fuel doesn’t stay in the energy bucket for long.
Truck freight prices posted their biggest monthly jump since April and are up nearly 25% from a year earlier. Transportation and warehousing costs rose 2% in October. Carl Weinberg, chief economist at High Frequency Economics, put it simply in comments to Transport Topics: “Transportation costs are the channel through which energy prices bleed through into core goods prices.”
That’s the pass-through story. A company pays more to ship parts, then pays more for the parts themselves, and eventually you pay more at checkout.
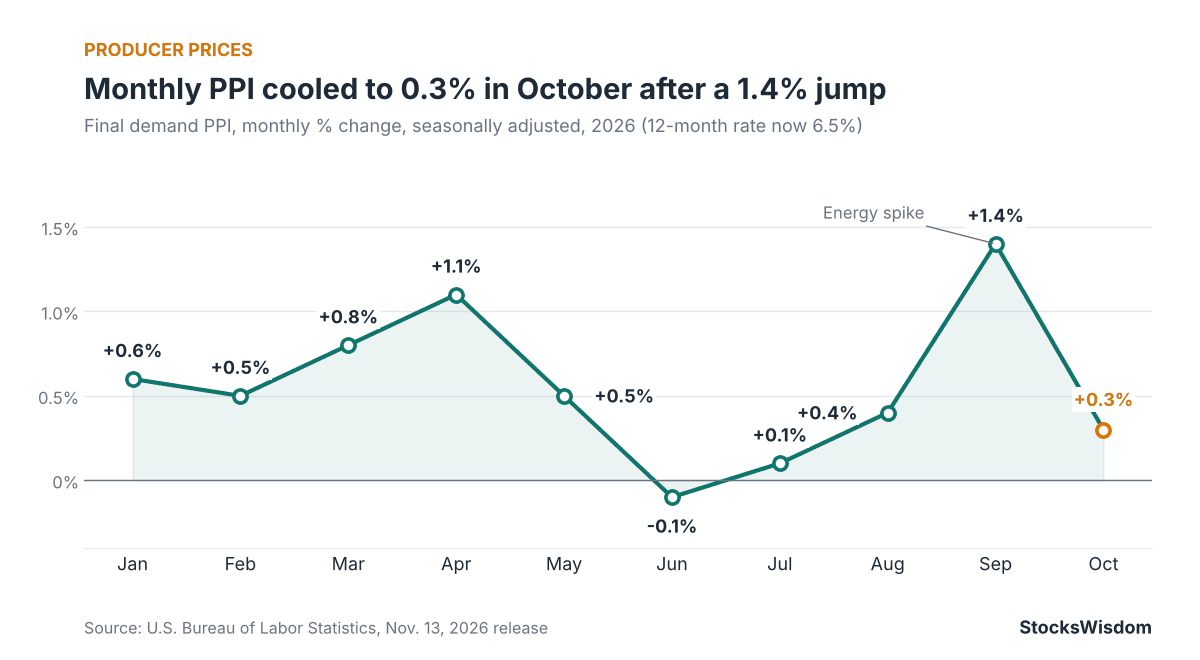
Producer prices haven’t risen in a straight line this year. They spiked in March and April, cooled through early summer, then exploded again in September when energy surged. October’s 0.3% looks soft only next to that 1.4% jump. Producer prices rose about 5.4% from December 2025 through September, compared with about 3.1% for consumer prices over the same period. The chart below shows the monthly change in final demand PPI for every month of 2026 so far.
Wholesale inflation usually leads consumer inflation by a few months. Our October CPI breakdown showed consumer prices rising 0.4% last month, hotter than expected. PPI at 6.5% says there’s more cost pressure still working its way down the pipeline.
The Fed held its target range at 3.75% to 4% on October 28, with two officials voting for a hike. Markets now price roughly an 85% to 88% chance of a quarter-point hike at the December 8 to 9 meeting. Chicago Fed President Austan Goolsbee said Friday, per TheStreet, “I believe that the central bank has definitely got work to do to continue to reestablish its credibility.”
Rate hikes in an inflation spike aren’t new. Rate hikes after years of investors expecting cuts? That’s a harder adjustment.
Borrowers. Mortgage rates follow the 10-year yield more than the Fed. Freddie Mac’s survey showed the 30-year fixed at 7.11% on November 12, down from 7.18% a week earlier, per Freddie Mac’s release. But that survey came before this week’s yield jump. Don’t be surprised if next week’s number ticks back up. We covered how yields feed into home loans in our post on the 10-year yield hitting its highest level since 2002.
Credit card and HELOC rates are tied to the prime rate, so a December hike would push them higher within a billing cycle or two. Paying down variable-rate debt now beats paying more on it later.
Savers. Here’s the upside. High-yield savings accounts, money market funds and short-term Treasury bills all pay more when the Fed hikes. With the 2-year near 4.9%, cash isn’t the dead weight it was a few years ago. Just keep an eye on the real return. A savings account paying 4.5% while prices rise around 4% leaves you only slightly ahead, so it’s a parking spot, not a long-term plan.
Stock investors. A 5%+ risk-free yield competes directly with stocks, especially expensive growth names. That’s part of why the Nasdaq lagged Friday, along with fallout from Jensen Huang’s exit at Nvidia. Companies with pricing power and steady cash flow tend to handle rising input costs better than those that can’t pass them on. If you want a quick read on how a particular stock is holding up, StocksWisdom shows its sentiment, technical signals and a 30-day forecast in one place.
Panic selling rarely helps. Rebalancing does. If tech has grown into an oversized chunk of your portfolio, this is a reasonable moment to trim back to your target mix.
CPI measures prices consumers pay. PPI measures prices producers receive for their output. PPI often moves first, because businesses tend to pass higher costs on to customers over the following months.
It can be. Higher producer costs squeeze profit margins unless companies raise prices, and hot inflation pushes the Fed toward hikes, which lifts bond yields. Higher yields make future earnings worth less today, which hurts richly valued stocks most.
Probably a bit. Mortgage rates track the 10-year Treasury yield, which climbed to about 5.15% this week. Freddie Mac’s 7.11% reading was taken before most of that move.
Are you shifting anything in your portfolio with the 10-year above 5%, or riding it out? Tell us in the comments.
Not financial advice. Do your own research.