Physical Address
304 North Cardinal St.
Dorchester Center, MA 02124
Physical Address
304 North Cardinal St.
Dorchester Center, MA 02124


September is over, and it behaved about the way its reputation suggests. The S&P 500 slipped 0.45% for the month, a small loss in what’s historically the worst month of the year for stocks (First Financial Trust). We looked at that pattern back in our September Effect breakdown.
Now the calendar flips to the stretch investors actually look forward to. The fourth quarter has been the best three months of the year for stocks since 1950, and October is already off to a good start. The S&P 500 closed Friday at 7,722.72, up about 0.9% in the first two trading days of the month, after a weak jobs report cooled fears of another Fed rate hike (Stocktwits).
So is Q4 really the best time to own stocks? And does 2026, a midterm election year with 5% bond yields, fit the pattern? Here’s what history says.
Since 1950, stocks have gained an average of 4.2% in the fourth quarter and finished higher about 80% of the time, according to Carson Group. No other quarter comes close. Q1 is second, averaging 2.2% (Axios).
Midterm election years have been even stronger in the fourth quarter. Here’s how the main seasonal stats stack up:
| Period | Historical record | Source |
|---|---|---|
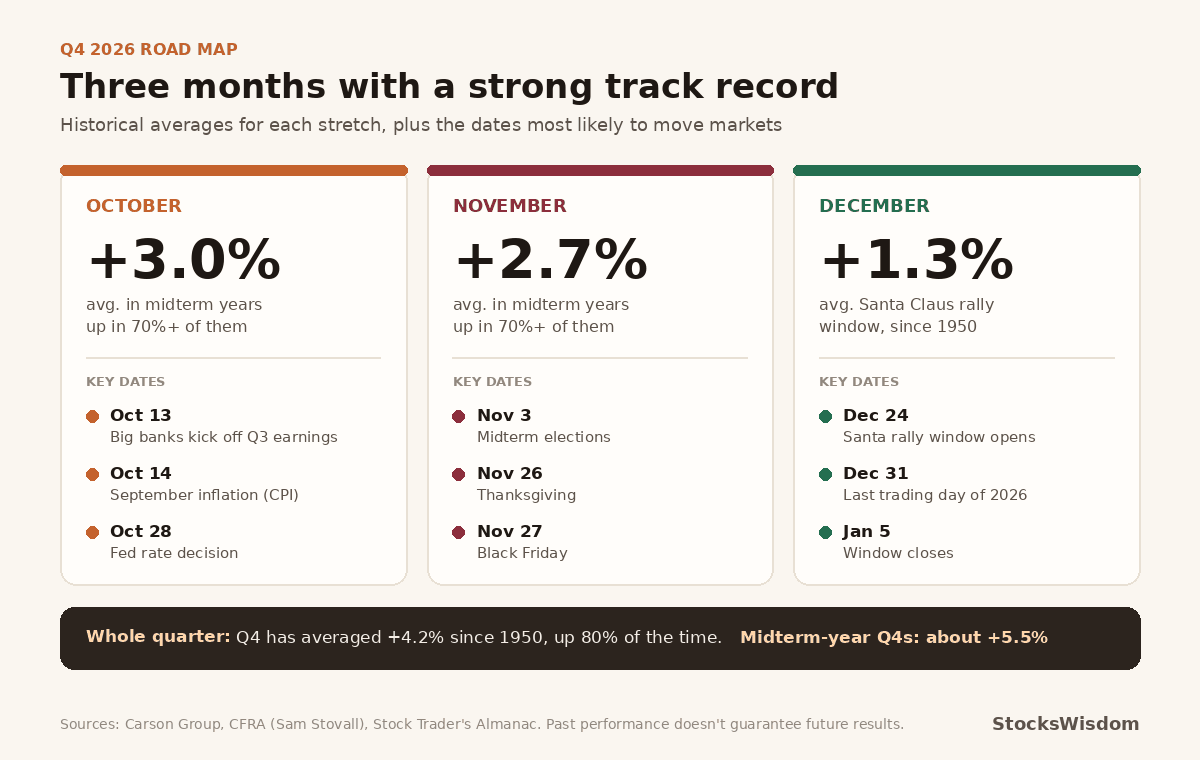
| Q4, all years since 1950 | Average gain 4.2%, up 80% of the time | Carson Group |
| Q4 in midterm years | Average gain about 5.5% | CFRA’s Sam Stovall |
| October in midterm years | Average gain 3.0%, up 70%+ of the time | Carson Group |
| November in midterm years | Average gain 2.7%, up 70%+ of the time | Carson Group |
| Santa Claus rally window | Average gain about 1.3% since 1950 | Stock Trader’s Almanac |
| Year after a midterm | Average gain 14.5%, up 95% of the time | Fidelity |
The graphic below maps those stats onto the Q4 2026 calendar, along with the dates most likely to move markets.
If Q4 is so good, why does October make investors nervous? Because some of the worst days in market history happened in October.
In 1929, the S&P 500 lost more than 12% on October 28 and another 10% the next day. On Black Monday, October 19, 1987, it fell 20.47% in a single session. In October 2008, during the financial crisis, the index dropped 9% on October 15 alone (KRDO/Stacker).
October is also the most volatile month on record. Its returns swing more than any other month’s, and eight of the 20 biggest one-day drops in S&P 500 history landed in October.
Here’s the twist. October’s average return is still positive, about 0.5%, and it finishes higher roughly 59% of the time. It’s a scary month, not a losing one.
October has another nickname that gets far less attention. The Stock Trader’s Almanac calls it a “bear killer,” because it has turned the tide in 13 bear markets since World War II, including 1957, 1966, 1974, 1987, 1990, 2002 and 2022.
That last one is recent enough to remember. The S&P 500 bottomed on October 12, 2022, and the bull market that started that day is still running nearly four years later.
So October tends to bring the volatility, and also tends to be where big declines run out of sellers.
Nobody can prove why the pattern exists. A few explanations come up again and again, though.
Holiday spending. The biggest shopping weeks of the year fall in Q4, which tends to help retailers and lift the general mood.
Year-end money. Bonuses get paid and people top up retirement accounts before the deadline. Fund managers also like their portfolios to look good when clients get year-end statements.
Tax-loss selling fades. Investors often dump losing stocks before December 31 to lower their tax bill. Once that selling is done, beaten-down names can bounce.
Fresh earnings. Third-quarter reports arrive in October and November, giving investors new numbers to trade on after a quiet summer.
This year adds a political wrinkle. Midterm elections are on November 3, and markets have a long habit of struggling in the months before a midterm and rallying afterward.
The usual explanation is uncertainty. Before an election, investors don’t know which party will control Congress, so big money waits. Once the results are in, that uncertainty disappears. As the Motley Fool put it this week, “The outcome of the election removes that layer of uncertainty and provides a better understanding of what conditions will look like moving forward” (Motley Fool).
The year after a midterm has been the best year of the four-year presidential cycle, averaging about 14.5% with gains 95% of the time, according to Fidelity data cited in the same piece. CFRA’s Sam Stovall noted midterm-year fourth quarters have averaged about 5.5%, and his advice for a year with a strong third quarter: “you want to let your winners ride.”
Seasonality is a tailwind, not a guarantee. A few things make 2026 different:
The jobs report helped. Employers added just 29,000 jobs in September and unemployment rose to 4.2%. Bad news for workers, but it cut the odds of an October rate hike to 22% from 64% a week earlier. Markets cheered.
Seasonal stats are averages, and averages hide a lot. An 80% win rate still means Q4 lost money in about one of every five years since 1950, and 2008 was one of them.
A few practical ways to use this:
Use it as context, not a trigger. A strong Q4 history is a reason to stay invested, not a reason to pile in with money you might need soon.
Stay calm during October swings. Volatility in October is normal. A 5% drop this month would be uncomfortable but not unusual.
Plan your year-end moves now. Q4 is when investors harvest tax losses, rebalance and max out retirement contributions. Doing it early beats rushing in late December.
Check the trend, not just the calendar. If you want to see whether a stock you own is lining up with the seasonal tailwind, StocksWisdom shows sentiment, technical signals and a 30-day forecast for each ticker.
Not on average. October is the most volatile month and has hosted famous crashes, but the S&P 500 has averaged a small gain in October and finished higher about 59% of the time.
It’s the tendency for stocks to rise over the last five trading days of December and the first two of January. Yale Hirsch named it in the Stock Trader’s Almanac in 1972. This year that window runs from December 24 to January 5.
Historically, yes. The 12 months after a midterm have been the strongest stretch of the presidential cycle, though past patterns don’t guarantee future results.
History is on the bulls’ side for the next three months, but 2026 is testing that history with high rates and sticky inflation. Are you staying invested through year-end, or waiting until after the election?
Not financial advice. Do your own research.