Physical Address
304 North Cardinal St.
Dorchester Center, MA 02124
Physical Address
304 North Cardinal St.
Dorchester Center, MA 02124

The Nasdaq Composite closed Friday at 25,437, down 2.9% in a single session and its worst day since June, according to Yahoo Finance. That left the tech-heavy index 7.8% below the record close it set on October 6. For the month, it lost about 5.2%, while the S&P 500 slipped 1.2% and the Dow actually rose 1.5%.
So is this a correction? A bear market? Just a bad week?
None of those labels fits yet, which is exactly why it’s worth knowing where the lines are. Headlines will start throwing these words around if the slide continues, and each one means something different for your money. Here’s how to tell them apart, what history says about each, and what (if anything) you should do.
Wall Street uses simple rules of thumb, all measured from the most recent closing high:
That’s it. There’s no committee that votes on it and no official announcement. A correction “starts” the day an index closes 10% below its peak, and a bear market starts the day it closes 20% below. Hartford Funds uses the same closing-price definitions in its widely cited research with Ned Davis Research.
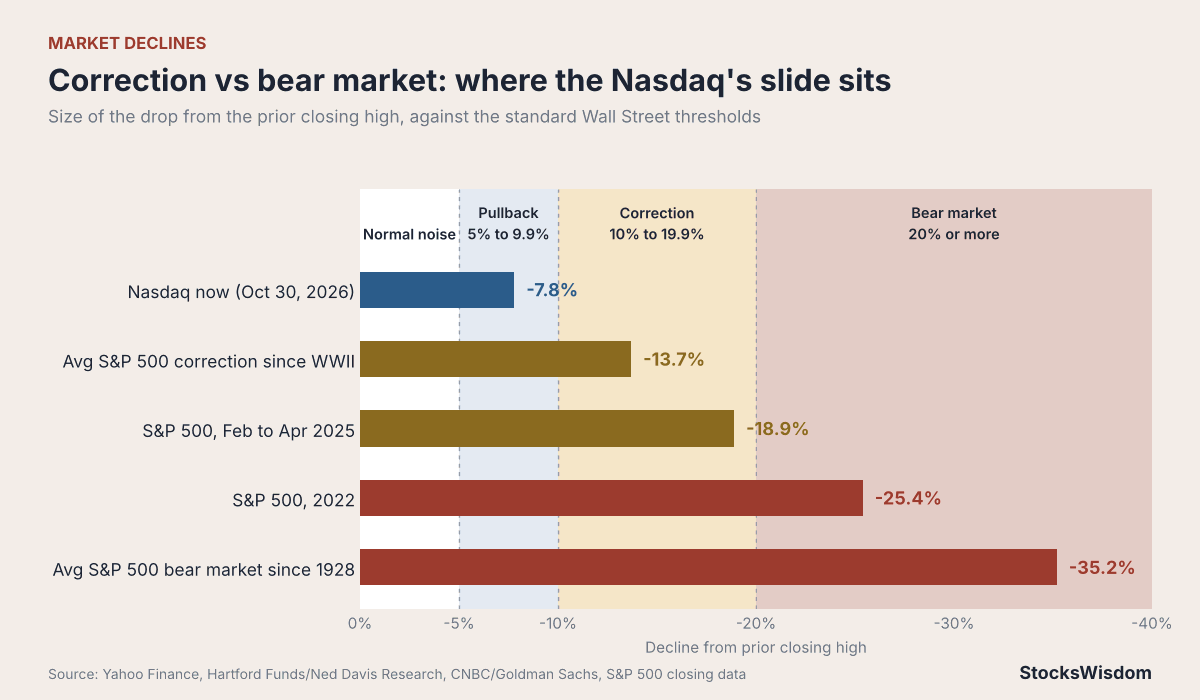
By that rule, the Nasdaq is in a pullback today. It would need to close around 24,830 (roughly 2.4% lower than Friday) to enter correction territory. The S&P 500 isn’t close to either line.
This one is mostly about AI spending. Alphabet dropped about 12.6% on Thursday after its results, and Intel lost nearly 29% on Friday after guiding fourth-quarter revenue to $15 billion to $16 billion, below the $16.5 billion it just reported. StockTitan noted that Intel’s drop was part of a broad chip sell-off, with a closely watched semiconductor index sinking 7.2% on the day.
We covered the details in our Intel Q3 2026 earnings breakdown, but the short version is that investors are asking a harder question now: when does all this capex start paying for itself?
Something else matters here. Meta and Alphabet both ended October more than 20% below their 52-week highs, per Yahoo Finance’s live coverage. That means two of the biggest stocks in the market are individually in bear markets even though the Nasdaq as a whole isn’t even in a correction. Index labels can hide a lot of pain inside specific names.
Declines are a normal cost of owning stocks, and they show up more often than most people expect. Capital Group’s study of the S&P 500 from 1954 through 2023 found these averages:
| Decline size | How often (average) | Average length |
|---|---|---|
| 5% or more | About once a year | 101 days |
| 10% or more | About once every 30 months | 234 days |
| 15% or more | About once every 5 years | 345 days |
| 20% or more | About once every 6 years | 370 days |
A 10% drop every two and a half years means a 30-year-old investor should expect a dozen or more corrections before retirement. Several bear markets, too.
Here’s where the two labels split apart in a way that matters.
Corrections tend to be quick. Data from Goldman Sachs and Bespoke cited by CNBC found that S&P 500 corrections since World War II averaged a 13.7% decline, and recoveries took about four months on average.
Bear markets hurt more and last longer. Since 1928, the average one has knocked the S&P 500 down about 35% over roughly 289 days, according to Hartford Funds. The good news on the other side: the average bull market has gained 112% and lasted about 2.7 years. Stocks have been rising roughly 78% of the time.
Recent history shows how messy the middle ground can be. In early 2025 the S&P 500 fell about 19% from its February high to its April low, a hair short of an official bear market. In 2022 it went all the way, falling about 25% before bottoming in October.
The chart below shows where today’s Nasdaq drop sits against those thresholds and past declines.
People often treat a bear market as a sign the economy is breaking. Sometimes it is. Often it isn’t.
Hartford counts 27 bear markets since 1928 but only 15 recessions over the same stretch. Markets price in fear, rate changes and valuation resets, and plenty of those never turn into job losses or shrinking GDP. A correction is even weaker as a recession signal.
That doesn’t mean the economy is fine right now. Oil is trading above $100 a barrel, and the Fed held rates steady on October 28 as traders price in a possible December hike. Those are real pressures on consumers and on company margins. But the label on the stock chart won’t tell you much about where the economy is headed by itself.
If you’re a long-term investor adding money every month, a pullback or a correction is mostly noise. It may even be helpful, because your regular contribution buys more shares at lower prices. We ran the numbers on that in our post on dollar-cost averaging vs lump sum.
A few practical moves make sense in any sell-off:
If you’re close to retirement, the math is different. A bear market right before you start withdrawals can do lasting damage, so a cushion of bonds or cash covering a few years of spending is worth more than any market call.
Not as of Friday’s close. The Nasdaq is 7.8% below its October 6 record, which puts it in pullback territory. The S&P 500 is down far less. A close 10% below the high is the correction line.
Since 1928, the average S&P 500 bear market has lasted about 289 days, or close to 10 months. The shortest was 33 days in 2020. The longest ran 630 days in 1973 and 1974.
Nobody can reliably call a bear market in advance, and selling means you also need to time the re-entry. Many of the best rally days come right after the worst ones, so most long-term investors are better off sticking to their plan and rebalancing.
Where do you draw your own line: does a 10% drop make you buy more, hold tight, or start trimming?
Not financial advice. Do your own research.