Physical Address
304 North Cardinal St.
Dorchester Center, MA 02124
Physical Address
304 North Cardinal St.
Dorchester Center, MA 02124

The S&P 500 just had its worst week in more than 18 months. It fell 8.6%, closed Friday at 6,910.39 and slid into a correction, more than 10% below its Oct. 6 record, according to the Associated Press. The Nasdaq did worse: down 10% for the week and 5.3% on Friday alone.
If you opened a brokerage app this week, you saw a wall of red rectangles with thin lines poking out of them. Those are candlesticks. They look like code, but each one tells a short story about a single trading day: where the price started, how far it ran in each direction and where the fight ended.
Here’s how to read them, using the week we just lived through as the example.
Every candle packs four prices into one shape: the open, the high, the low and the close. That’s why you’ll hear traders call it an OHLC chart.
The thick part is the real body. It covers the distance between the open and the close. Thin lines above and below are the shadows, also called wicks or tails. Top of the upper shadow is the session’s high; bottom of the lower shadow is the low, as StockCharts ChartSchool lays out.
Color tells you direction. A green (or hollow) body means the close was above the open. A red (or filled) body means it closed below the open. Most apps use green and red now, while older black-and-white charts use empty and filled bodies, per Britannica Money.
A line chart only connects closing prices. A candle shows you the path, and the path is where most of the information hides.
Friday, Nov. 20 is a textbook case. According to Motley Fool’s market recap, the S&P 500 traded between 6,882.66 and 7,198.67 during the session, then closed at 6,910.39.
Think about what that means. The day’s high sat only about 23 points above Thursday’s close of 7,175.83. Buyers made a brief push and got nowhere. Sellers ran the rest of the day, and the index finished just 28 points above its low.
Put another way, the close landed in the bottom 9% of a 316-point range.
That’s a long red body with a stubby lower wick. Traders read that shape as “sellers were in control right up to the bell,” and on Friday they were.
None of it came out of nowhere. Nvidia fell 14% on reports of a potential SEC accounting probe, and Broadcom dropped about 12% on unconfirmed reports that Google would cut chip orders, per the same recap. We covered the buildup in our post on the VIX fear gauge hitting 36.
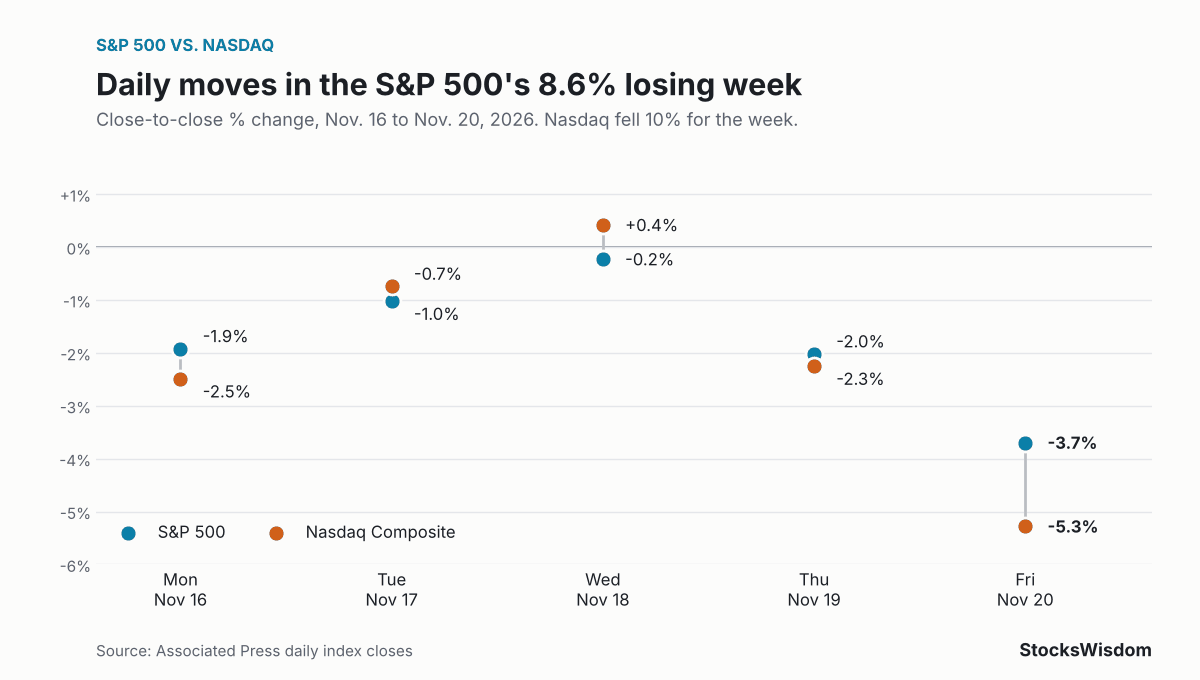
Zoom out to the five daily candles and the story gets clearer. Friday marked seven straight losing sessions for the S&P 500, counting the last two days of the prior week. Daily figures come from AP’s closing tallies, starting with Monday’s.
| Day | S&P 500 close | S&P 500 change | Nasdaq change |
|---|---|---|---|
| Mon, Nov. 16 | 7,416.59 | -1.9% | -2.5% |
| Tue, Nov. 17 | 7,340.53 | -1.0% | -0.7% |
| Wed, Nov. 18 | 7,323.63 | -0.2% | +0.4% |
| Thu, Nov. 19 | 7,175.83 | -2.0% | -2.3% |
| Fri, Nov. 20 | 6,910.39 | -3.7% | -5.3% |
Wednesday is the interesting one. The Nasdaq rose 0.4% while the S&P 500 slipped 0.2% and the Dow lost 1.1%. Small bodies on days like that often signal indecision, a pause before the next move. This time the next move was down, and it was big.
Friday’s drop was the largest of the week for both indexes, and the Nasdaq fell harder than the S&P 500 on three of the five days. The chart below shows each day’s move side by side.
Hundreds of named patterns exist. You need maybe five.
Look again at the hammer and the hanging man. They’re identical shapes. Only the trend before them tells you which one you’re staring at, so context isn’t a bonus with candlesticks. It’s most of the meaning.
Japan’s rice markets get the credit. Munehisa Homma (1724 to 1803), a rice trader at the Dojima Rice Exchange in Osaka, is often called the father of the candlestick chart, per Wikipedia. Historians aren’t sure he drew them in their modern form, though. StockCharts says candlestick charting “first appeared sometime after 1850” and that Homma’s ideas were likely refined over many years.
Western traders mostly ignored the method until Steve Nison’s 1991 book, Japanese Candlestick Charting Techniques. Now it’s the default view on nearly every trading app.
Treating one candle as a signal is the big one. StockCharts is blunt here: doji “are not enough to mark a reversal,” and hammers and hanging men “require confirmation before action.” Confirmation usually means the next candle or two moving the way the pattern suggests.
Ignoring the timeframe comes next. A hammer on a 5-minute chart and a hammer on a weekly chart are very different animals. Longer timeframes carry more weight because more money and more time went into forming them.
Then there’s volume. A huge red candle on thin trading says less than the same candle on heavy trading.
And don’t forget the news. Friday’s candle wasn’t a mysterious chart signal. It was Nvidia headlines and an AI trade coming apart.
If you buy index funds every month for retirement, you don’t need to trade candlestick patterns. You can still use them to read the mood. Friday’s candle told you sellers owned the whole session. It didn’t tell you where the market will be in January.
For long-term savers, the more useful lens is the one from our correction vs bear market explainer: 10% drops happen often, and how you respond matters more than the shape of any single day. Selling a 401(k) because a red candle looks scary is how people lock in losses.
If you trade individual stocks, candles can help with timing. StocksWisdom shows a stock’s sentiment, technical signals and 30-day forecast in one place, which is handy for checking whether a pattern you spotted lines up with the bigger picture before you act.
Green means the price closed above where it opened for that period. Red means it closed below the open. Color says nothing about the prior day, so a stock can gap up, drift lower and print a red candle while still finishing higher than yesterday.
Not very, on their own. They work better as one input next to trend, volume and support levels. Most chartists wait for the next candle to confirm a pattern before acting.
Start with daily candles. They filter out intraday noise and match the news you’ll read about. Weekly candles are good for the big picture.
So what do you look at first on a candlestick chart: the body, the wicks or the volume bar underneath? Tell us in the comments.
Not financial advice. Do your own research.