Physical Address
304 North Cardinal St.
Dorchester Center, MA 02124
Physical Address
304 North Cardinal St.
Dorchester Center, MA 02124

Wall Street’s fear gauge just had its loudest day in more than a year and a half. The Cboe Volatility Index, better known as the VIX, jumped about 26% on Friday to close near 36, after briefly touching 40 late in the session. That’s its highest level since the April 2025 tariff panic, according to Bloomberg data cited by ad-hoc-news.
Stocks gave it plenty of reasons. The S&P 500 sank 3.7% to 6,910.39 and officially entered a correction, now more than 10% below its October 6 record. The Nasdaq Composite lost 5.3% and wiped out its gains for 2026, per the Associated Press.
So what is the VIX actually telling you, and should a number on a screen change what you do with your 401(k)? Let’s walk through it.
Yesterday we asked whether a stock market correction was coming. It arrived about 24 hours later. AI stocks led the slide again. Nvidia dropped about 14% to $125.53 on reports of a possible SEC accounting probe, and Broadcom fell roughly 12% on an unconfirmed report that Google would cut next year’s chip orders, The Motley Fool reported.
| Index | Friday close | Day change | Week change | 2026 so far |
|---|---|---|---|---|
| S&P 500 | 6,910.39 | -3.7% | -8.6% | +0.9% |
| Dow Jones | 48,147.33 | -1.9% | -8.0% | +0.2% |
| Nasdaq Composite | 22,617.73 | -5.3% | -10.0% | -2.7% |
| Russell 2000 | 2,581.79 | -2.8% | -7.5% | +4.0% |
That -8.6% week is the S&P 500’s worst in more than 18 months. A full year of gains, gone in five trading days.
The VIX doesn’t track stock prices. It tracks the price of insurance.
Every day, traders buy and sell options on the S&P 500. When people get nervous, they pay up for puts (contracts that pay off if stocks fall). Cboe takes those option prices and backs out how much movement the market expects over the next 30 days. That expected swing, stated as an annualized percentage, is the VIX.
A few things follow from that:
Here’s a handy trick traders use, called the rule of 16. Divide the VIX by 16 (roughly the square root of 252 trading days) and you get the market’s expected daily move.
At 36, that’s about 2.25% a day. On an S&P 500 near 6,900, options are pricing typical daily swings of around 155 points, up or down. Over a month, the same math (36 divided by the square root of 12) points to moves of roughly 10%.
Compare that with calm markets. In 2024, the VIX averaged just 15.61, according to SIFMA, which works out to daily moves of about 1%.
SIFMA’s data also shows how rare a reading like Friday’s is. Since 2000, the VIX has sat between 20 and 30 on 29.3% of trading days. It’s been between 30 and 40 on just 6.6% of days, and above 40 on only 3.0%, mostly during the 2008 financial crisis and early COVID.
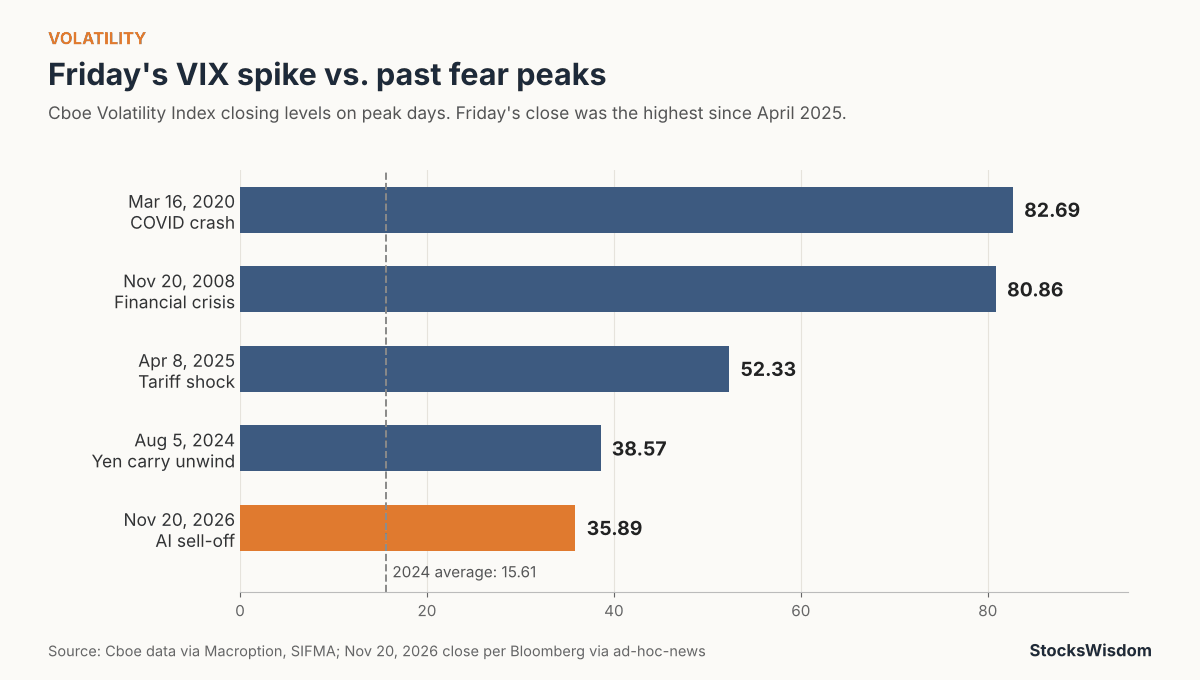
Scary? Sure. Historic? Not even close. The VIX’s record close is 82.69 on March 16, 2020, as COVID lockdowns spread, CNBC reported at the time. The previous record, 80.86, came on November 20, 2008. Yes, exactly 18 years ago today. Its all-time intraday high was 89.53 on October 24, 2008, per Macroption’s record of Cboe data.
More recent spikes were sharp but brief. On August 5, 2024, the yen carry trade unwind sent the VIX to 65.73 intraday, yet it closed at 38.57. In April 2025, tariff shock pushed it to a 52.33 close. The chart below shows how Friday’s reading stacks up against those peak closes.
No single headline did this. It’s a pile-up:
If you’re a long-term investor: readings above 30 tend to show up when fear is already intense, which is why some investors treat them as a contrarian signal. That doesn’t mean the bottom is in. In 2008, the VIX stayed above 40 for weeks. But panic-selling after a 10% drop locks in a loss that time usually repairs. If you’re still adding to a 401(k) or IRA every paycheck, you’re buying at lower prices this week.
If you’re close to retirement: this is a reminder to check that money you’ll need in the next two to three years isn’t sitting in stocks. That’s an allocation question, not a market-timing one.
If you hold individual stocks: expect wider swings and gappier opens. Stop-loss orders can fill far below your price when a stock opens 10% lower. If you want a quick read on a single holding before deciding anything, StocksWisdom shows a stock’s sentiment, technical signals and 30-day forecast in one place.
If you’re a saver or borrower: a spooked stock market pushed the 10-year Treasury yield down to about 4.91% on Friday. Mortgage rates often follow that yield, so a stretch of fear can bring slightly cheaper borrowing, even with the Fed leaning toward a hike.
If you trade options: puts and calls just got expensive. High VIX readings mean you’re paying a lot for protection, which is why some traders sell premium instead of buying it. That’s a riskier game than it looks.
Readings in the mid-teens are typical for calm markets. Above 20 signals rising worry, above 30 is unusual stress, and above 40 has mostly appeared during real crises like 2008 and 2020.
No. The index itself isn’t tradable. You can trade VIX futures, options and exchange-traded products tied to them, but those lose value over time in calm markets and are built for short-term trading, not buy-and-hold.
Not necessarily. The VIX measures expected movement, and big rebounds often happen when it’s high. Some of the market’s best days have come in the middle of its worst stretches.
So, how are you handling the swings? Buying the dip, sitting tight, or checking your portfolio less often? Tell us in the comments.
Not financial advice. Do your own research.